
Figure 4.
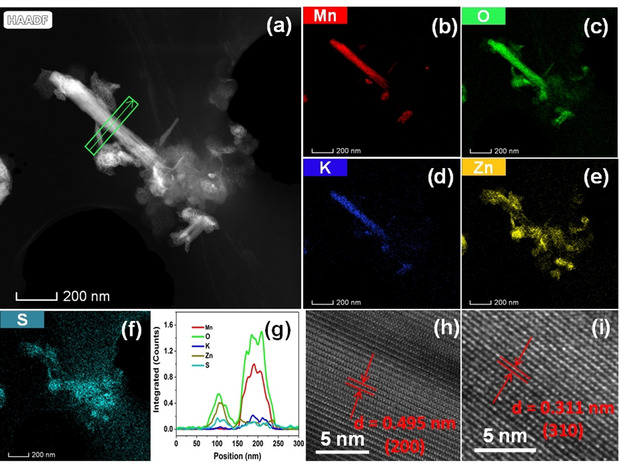
TEM/HRTEM images of MnO2 electrodes after first discharge. a) STEM‐HAADF (high‐angle annular dark‐field) image of short nanorods. b–f) STEM‐EDS mappings of different elements. g) Line profiles of different elements across the α‐MnO2 nanorod. h, i) HRTEM images.