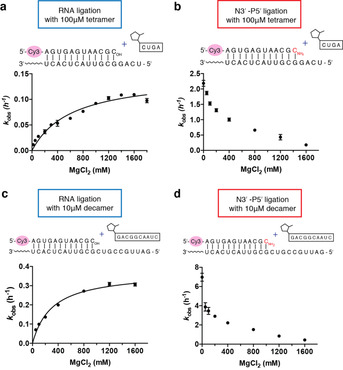
Figure 2.

Rates of oligonucleotide ligation reactions as a function of Mg2+ concentration. a) Ligation rates of RNA primer with 100 μm tetramer (2‐MeImp‐CUGA). b) Ligation rates of 3′‐amino terminated primer with 100 μm tetramer (2‐MeImp‐CUGA). c) Ligation rates of RNA primer with 10 μm decamer (2‐MeImp‐GACGGCAAUC). d) Ligation rates of 3′‐amino terminated primer with 10 μm decamer (2‐MeImp‐GACGGCAAUC). All experiments were carried out with 2 μm primer, 4 μm template, 200 mm HEPES, pH 8.0, 100 μm tetramer or 10 μm decamer, and MgCl2 at the indicated concentration. Data are reported as the mean±s.d. from triplicate experiments. Representative PAGE data are shown in Figures S5–S8.
