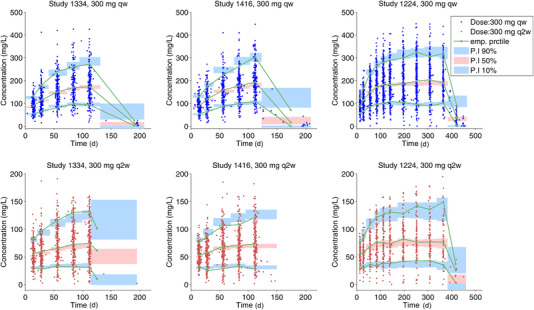
Figure 3.

Visual predictive check of dupilumab concentrations by study and treatment regimen—primary covariate model (Model 4). PI, predicted interval; qw, weekly; q2w, every 2 weeks.

Visual predictive check of dupilumab concentrations by study and treatment regimen—primary covariate model (Model 4). PI, predicted interval; qw, weekly; q2w, every 2 weeks.