
Figure 3.
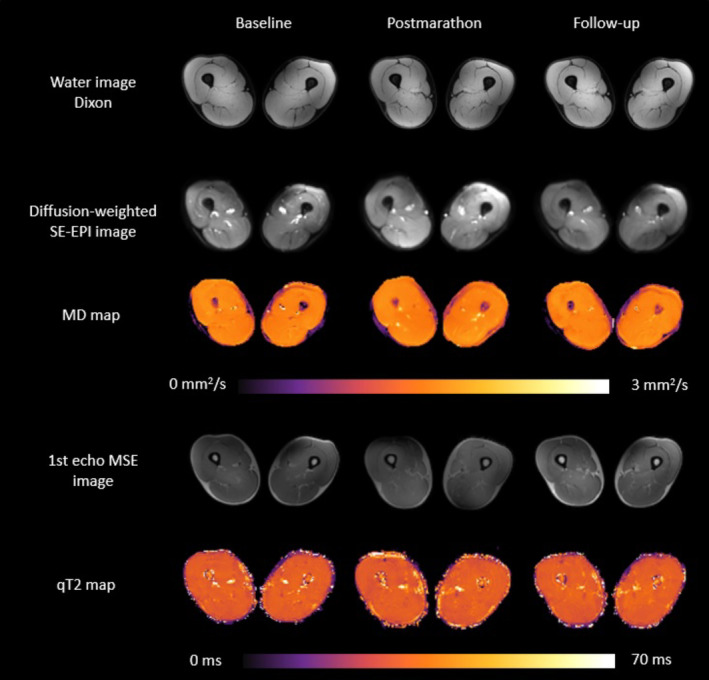
Raw and processed example images of a representative subject (47 years/male) for the three timepoints. Left column: baseline, middle column: postmarathon and right column: follow‐up. Top: water images from Dixon sequence. Middle: raw diffusion images for b = 0 s/mm2 and MD maps. Bottom: raw images from first TE of T2 sequence and processed EPG T2 maps.