
Figure 6.
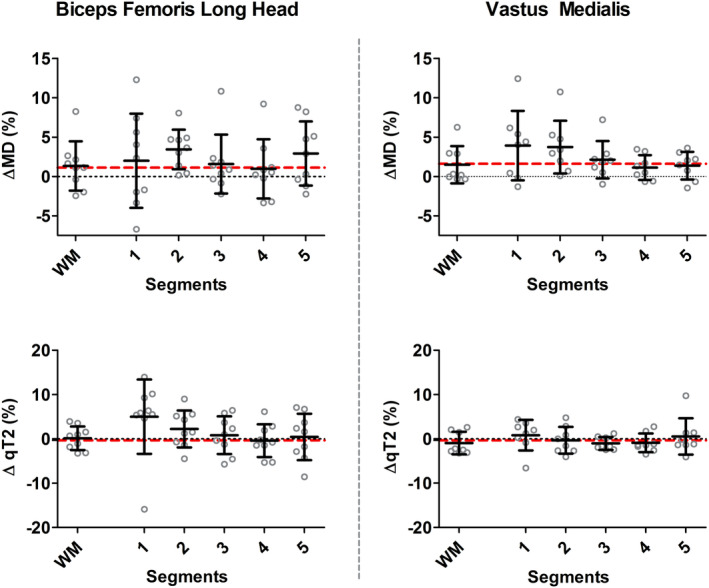
Comparisons between whole muscle volume and local measurements in percentage change. Scatterplots showing mean diffusivity (MD) (top) and qT2 (bottom) for the BFL (left) and VM (right) muscle for all subjects based on a whole volume assessment and the five local measurements. Relative change was determined per subject between baseline and postmarathon measurements. Each gray dot reflects the relative change between baseline and postmarathon for an individual subject, with the group mean and standard deviation shown in black. The red dotted line represents the average Δ% for the whole muscle volume measurements between baseline and postmarathon.