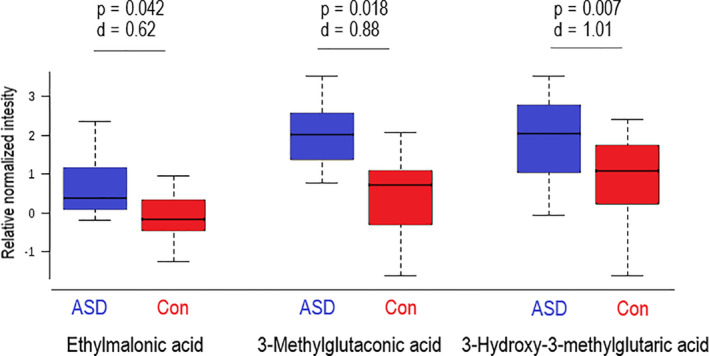
Figure 3.

Urinary metabolites in Autism Spectrum Disorder (ASD) and control (Con) groups. Boxplots of three urinary metabolites that differed significantly between ASD and Con. Effect size d‐values (>0.5) are included to show the magnitude by which these metabolites were elevated in the ASD group. Outliers not shown.
