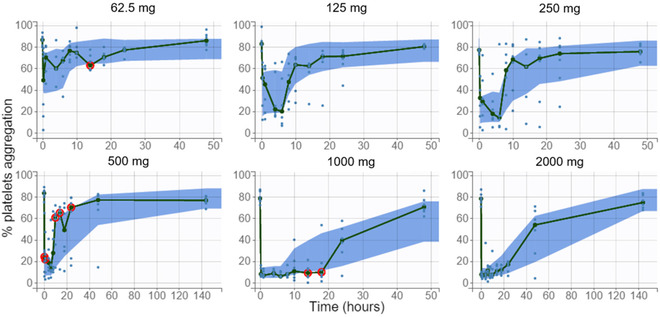
Figure 5.

Visual predictive check for ex vivo platelet aggregation by dose. Empirical median (green line) and 90% prediction interval of the model for the median (blue area). Red circles indicate empirical medians outside of the model prediction interval. Observations as blue dots.
