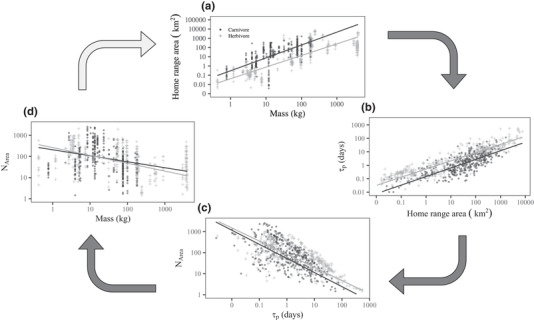
Figure 3.

Mechanisms driving body‐size‐dependent estimation bias: (a) positive allometry of home‐range areas, (b) correlation between home‐range area and range‐crossing time (τp), (c) negative correlation between τp and effective sample size (N area) governed by duration of observation period (T) and τp such that N area T/τp, and (d) resulting negative allometry of N area (axes, log scaled; lines, phylogenetically controlled fitted regression models). From (a) to (d), 1 axis is preserved from the previous panel to demonstrate the inherent link between each of these relationships (arrows, visual aid of link; top‐left arrow, end of the chain).
