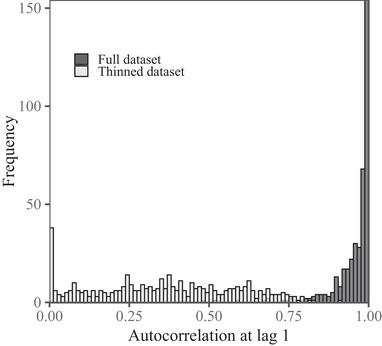
Figure 4.

Frequency of amounts of autocorrelation at lag 1 in the full tracking data sets for each of the 757 individuals used to estimate home ranges via conventional kernel density estimation (KDE), compared with the thinned data sets for individuals for which sufficient data remained after thinning to apply KDE.
