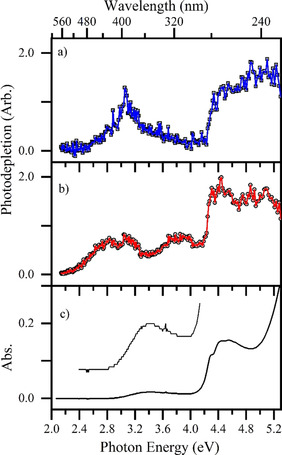
Figure 4.

Gas‐phase absorption (photodepletion) spectra of a) [MnL(CO)3(CH3CN)]⋅H+ and b) [MnL(CO)3]⋅H+ (solid lines connect data points), displayed with c) the solution‐phase absorption spectrum of TryptoCORM (in H2O:CH3CN 1:1), vertically expanded for the region between 2.4–4.2 eV.
