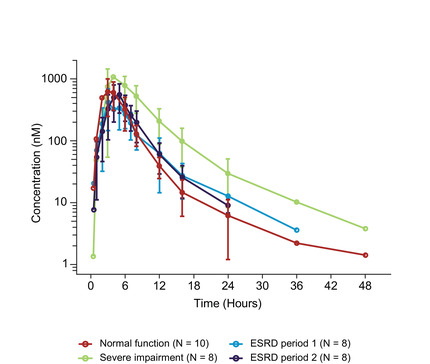
Figure 2.

Itacitinib plasma concentrations (mean ± standard deviation) vs time after dosing stratified by renal function groups. Plasma concentrations are shown at time points when the majority of data points were measurable. ESRD, end‐stage renal disease.
