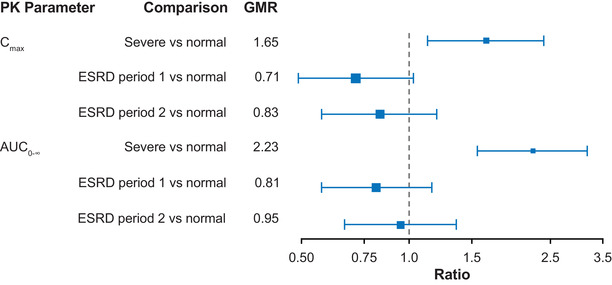
Figure 3.

GMR and 90% confidence intervals for Cmax and AUC0‐∞ comparison for severe renal impairment and ESRD vs normal renal function. AUC0‐∞, area under the plasma concentration time curve from time zero to infinity; Cmax, maximum plasma drug concentration; ESRD, end‐stage renal disease; GMR, geometric mean ratio; PK, pharmacokinetic.
