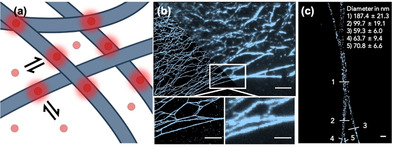
Figure 3.

(a) A cartoon showing how PAINT works. The probe (red circle) can reversibly bind to the fibres (blue shapes). When they are bound, they fluoresce and can be imaged; (b) low resolution (right) vs. PAINT image (left). Scale bar top image represents 5 μm. Scale bar bottom image represents 2.5 μm; (c) Magnification of a crossed fibre. Scale bar represents 200 nm. Image correspond to FmocFF 1.5 mg mL−1, 40 % DMSO, 20 nm Cy5FF representing the 1.78×10⁻⁴ mol %. The numbers represent the different points at which the diameter of the fibre was measured.
