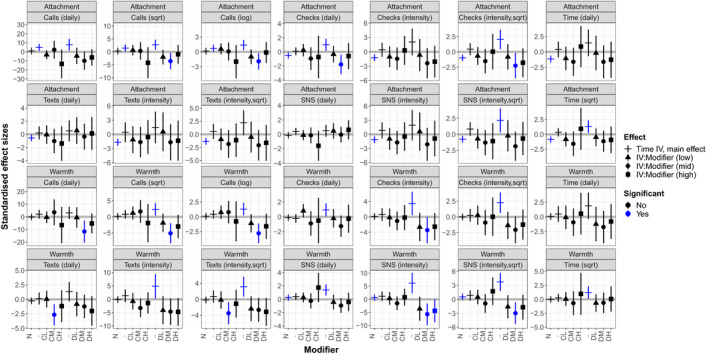
Figure 2.

Effect size values for each smartphone use variable predicting parenting. Note. Separate panels for each independent variable. Y‐axis represents effect size estimates (log‐odds scaled for ease of interpretation), with horizontal line denoting zero and blue indicators denoting significant effect. X‐axis shows values with no modifier in the model (N), values for smartphone use X family conflict interaction (C), and values for smartphone use X family displacement interaction (D) at low (L), medium (M), and high (H) levels. Effect sizes for parental attachment are shown in top rows, and effect sizes for warmth are in bottom rows
