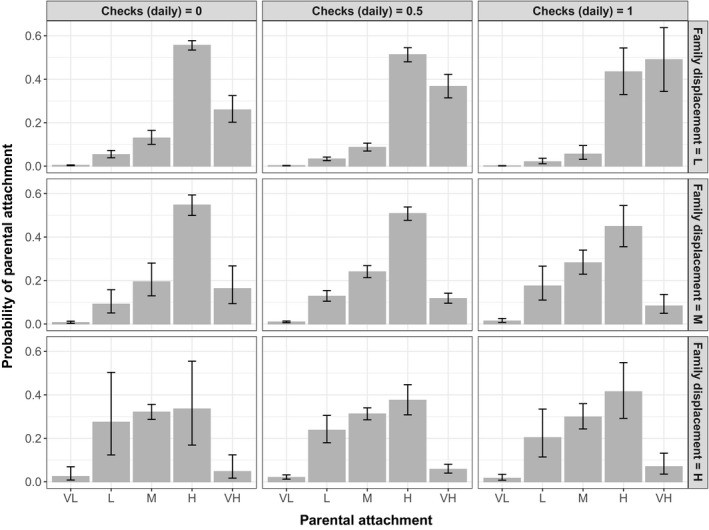
Figure 4.

Plots of moderator effects; Relation between daily checking predicting parent–child attachment at different levels of family displacement. Note. Separate columns for low (0), medium (.5), and high (1) levels of daily checking. X‐axis reflects each level of parental attachment, from very low (VL), low (L), moderate (M), high (H), to very high (VH). Y‐axis reflects probability (with confidence intervals) of belonging to each parental attachment level. Separate rows for different levels of family displacement at low (L), medium (M), and high (H) levels
