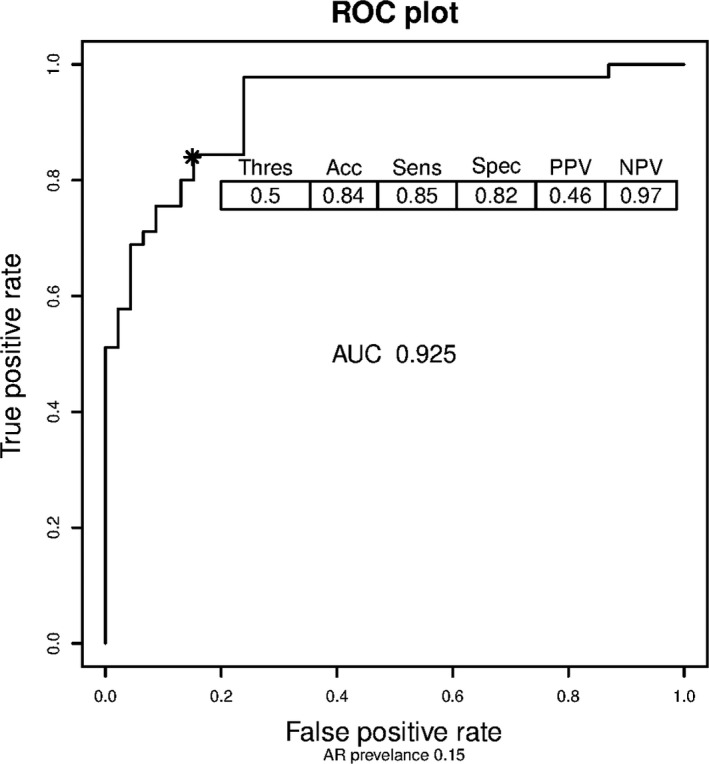
FIGURE 2.

The receiver operating curves (ROC)—AR vs TX (NU discovery cohort). The area under the curve is displayed as well as the performance characteristics (15% AR prevalence adjustment) at the 0.5 threshold (asterisk). AR, acute rejection; NU, Northwestern University; TX, Transplant eXcellent
