Figure 3.

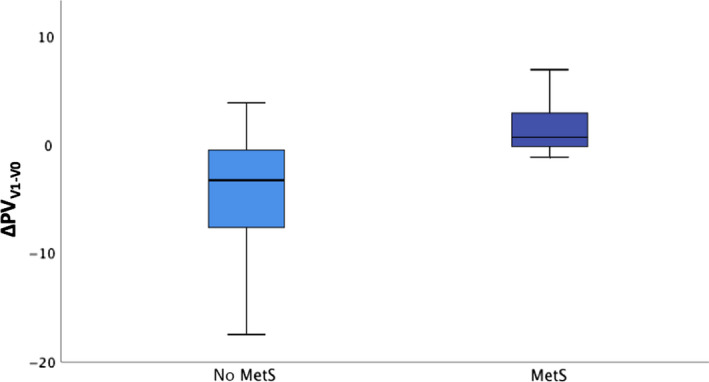
PV reduction (Δ) at V1 in patients without (no MetS) and with metabolic syndrome (MetS) (P = .017). Colored boxes indicate interquartile range (IQR), and center vertical lines indicate median

PV reduction (Δ) at V1 in patients without (no MetS) and with metabolic syndrome (MetS) (P = .017). Colored boxes indicate interquartile range (IQR), and center vertical lines indicate median