Figure 1.

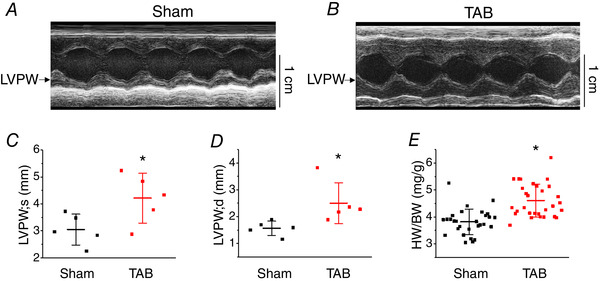
Echocardiographic properties of Sham and TAB rat hearts
Representative echocardiographic M‐mode images in age‐matched Sham (A) and TAB rats (B) at the level of mitral valve. Left ventricular posterior wall (LVPW) dimensions of TAB rats are significantly increased in comparison to Sham, both in systole (C) and diastole (D). Mean ± SD of data indicated by line. N = 5 per group, * P = 0.04 (LVPW; s) and * P = 0.05 (LVPW; d), Student's t test. (E) Heart weight to body weight ratio of rats used in the present study. Mean ± SD of data indicated by line, Sham, N = 29; TAB, N = 30. * P < 0.001, Student's t test.
