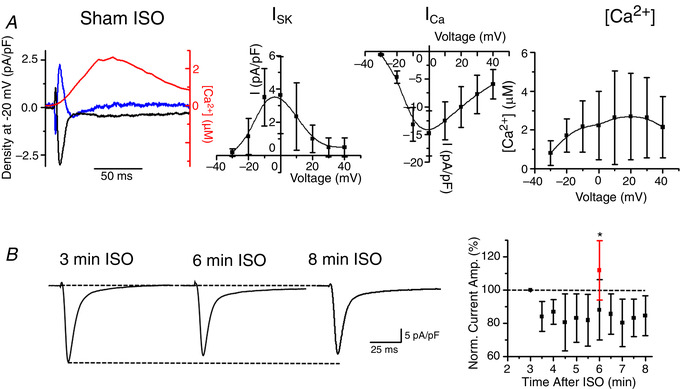
Figure 8.

SK current in Sham rat VMs with application of ISO
A, representative superimposed traces of I SK (blue), I Ca (black) and [Ca2+]i transient (red) recorded in Sham VMs depolarized to −20 mV (left). I SK was obtained by application of 1 nmol L–1 APA. Pooled I–V and peak [Ca2+]/V relationships. B, representative inward current traces recorded in Sham VMs at 3, 6 and 8 min following application of 100 nmol L–1 ISO at −10 mV (HP −40 mV). Right: plot of normalized inward current amplitude vs. time after application of ISO. Mean ± SD, n = 5, N = 2. The normalized inward current after 6 min of ISO and 3 min of 100 nmol L–1 apamin is plotted in red. Mean ± SD, n = 8, N = 7, * P = 0.04 vs. ISO only, Student's t test.
