
Figure 13.
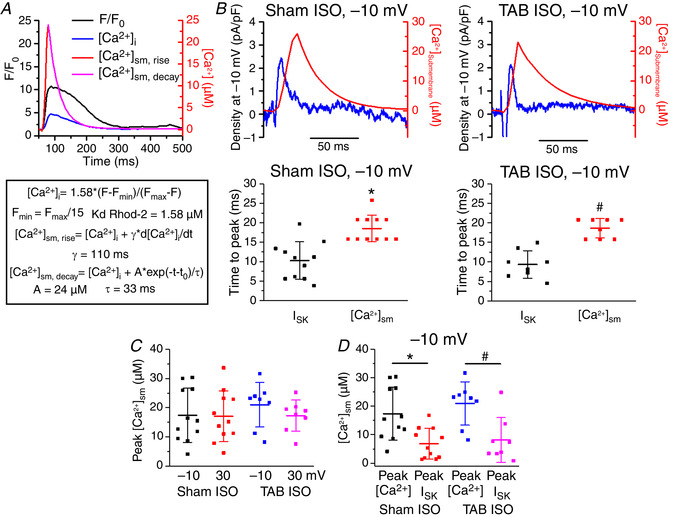
ISK peaks, whereas submembrane [Ca2+] continues to rise, indicating an inhibition of ISK by Ca2+
A, sample traces and equations for calculating submembrane Ca2+ concentration ([Ca2+]sm) based on calculations used previously (Weber et al. 2002). B, top: representative traces of I SK (blue) and [Ca2+]sm (red) at a –10 mV voltage step under ISO stimulation (100 nmol L–1). Bottom: plots of the time to peak for I SK and [Ca2+]sm in Sham and TAB myocytes. Line indicates mean ± SD. * P = 1.7 × 10⁻⁴, n = 11, N = 8, Student's t test. #P = 2.4 × 10⁻⁵, n = 8, N = 7, Student's t test. C, plot of peak [Ca2+]sm at −10 and 30 mV voltage steps under ISO stimulation (100 nmol L–1 for 3 min). Line indicates mean ± SD. There is no significant difference in any of the peak [Ca2+]sm values, P = 1, one‐way ANOVA, with a Bonferroni post hoc test. D, plot comparing the [Ca2+]sm at the peak [Ca2+] to [Ca2+]sm at peak I SK for Sham and TAB myocytes under ISO stimulation. Line indicates mean ± SD. * P = 0.001, n = 11, N = 8, paired Student's t test. #P = 0.003, n = 8, N = 7, paired Student's t test.