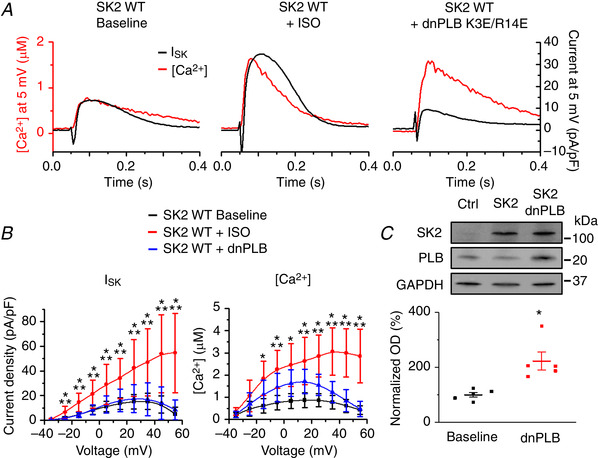
Figure 14.

Effects of β‐adrenergic stimulation on ISK in cultured rat VMs overexpressing rSK2
A, Representative traces of [Ca2+]i transients and I SK before and after application of ISO (100 nmol L–1) in control rSK2‐overexpressing VMs and VMs co‐expressing dnPLB. VMs were cultured with adenoviral expression vectors for 48 h. B, pooled I–V and [Ca2+]/V relationships for (A). Mean ± SD, n = 8–10, N = 4–5. I SK: * P = 0.002 (−35 mV), P = 0.003 (−25 mV), P = 2.6 × 10⁻⁴ (−15 mV), P = 0.002 (−5 mV), P = 0.003 (5 mV), P = 0.002 (15 mV), P = 0.002 (25 mV), P = 0.003 (35 mV), P = 0.001 (45 mV), P = 6.3 × 10⁻⁵ (55 mV) vs. baseline. ** P = 0.002 (−35 mv), P = 0.002 (−25 mV), P = 1.6 × 10⁻⁴ (−15 mV), P = 0.002 (−5 mV), P = 0.006 (5 mV), P = 0.005 (15 mV), P = 0.004 (25 mV), P = 0.004 (35 mV), P = 8.7 × 10⁻⁴ (45 mV), P = 8.5 × 10⁻⁵ (55 mV) vs. dnPLB. [Ca2+]: * P = 0.001 (−15 mV), P = 3.2 × 10⁻⁴ (−5 mV), P = 2.3 × 10⁻⁴ (5 mV), P = 1.7 × 10⁻⁴ (15 mV), P = 4.3 × 10⁻⁶ (25 mV), P = 2.3 × 10⁻⁶ (35 mV), P = 1.6 × 10⁻⁶ (45 mV), P = 1.8 × 10⁻⁶ (55 mV) vs. baseline. ** P = 0.04 (−5 mV), P = 0.04 (15 mV), P = 5.8 × 10⁻⁴ (25 mV), P = 2.7 × 10⁻⁵ (35 mV), P = 3.6 × 10⁻⁶ (45 mV), P = 1.1 × 10⁻⁶ (55 mV) vs. dnPLB, one‐way ANOVA with a Bonferroni post hoc test. C, representative western blots from VMs probed for SK2 and PLB. The control lane (Ctrl) represents VMs infected with virus carrying an empty vector, the SK2 lane represents VMs infected with a WT SK2 virus, and the SK2 dnPLB lane represents VMs infected with WT SK2 and dnPLB viruses. Mean ± SD optical density normalized to GAPDH for SK2 at baseline is 100 ± 58.9 and SK2 + dnPLB is 150.3 ± 22.6. Mean ± SD optical density for PLB at baseline is 99.99 ± 19.8 and for SK2 + dnPLB 222.6 ± 73.04, which is significantly different compared to baseline, P = 0.02, Student's t test, N = 5.
