
Figure 1.
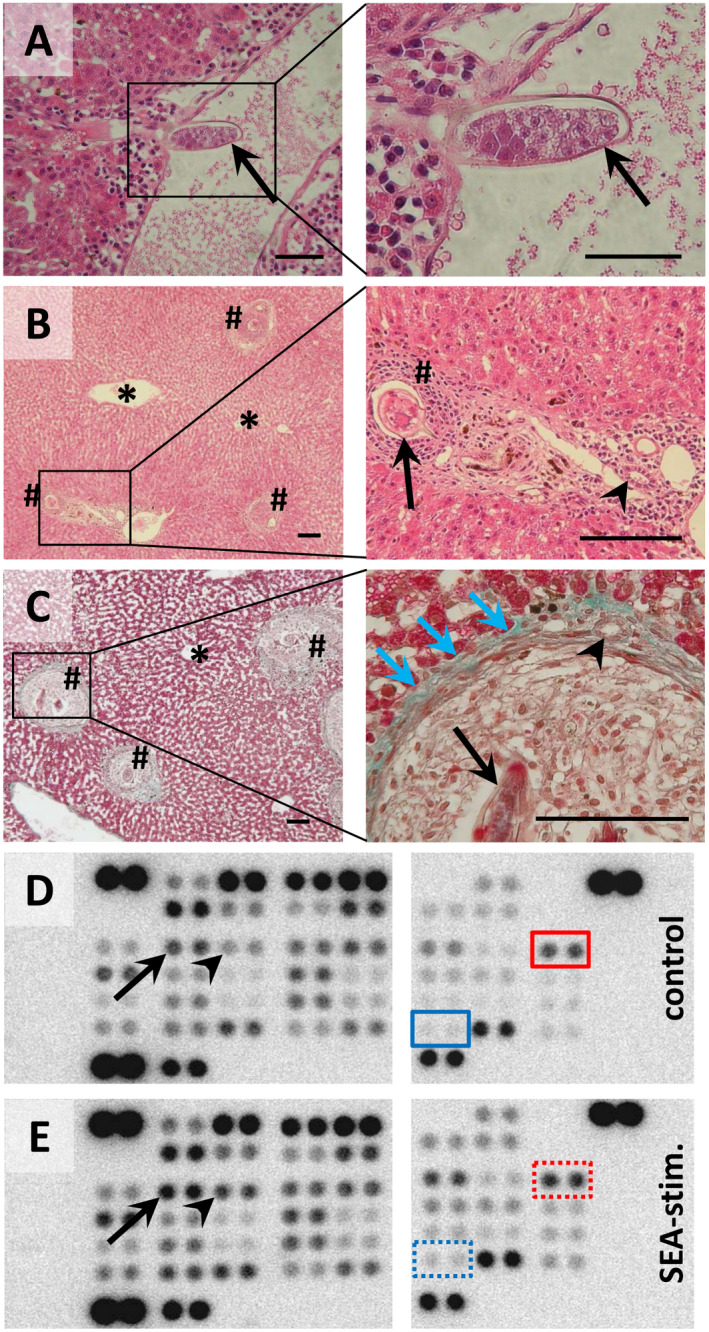
Liver‐trapped eggs of S. mansoni during lodging and granuloma formation in Syrian hamsters. (A) S. mansoni egg (arrow) entering the liver parenchyma through a branch of the portal vein. (B,C) Eggs were trapped in the liver around the portal tracts. At 6 weeks post infection, the eggs were surrounded by a dense population of immune cells, followed by a band of fibrovascular tissue (blue arrows), leading to the formation of a mature granuloma (hash). The parenchyma around the central vein (star) was free from granuloma. Formalin‐fixed, paraffin‐embedded liver sections stained with hematoxylin and eosin (A,B) or Masson Goldner staining kit (C). Arrowheads indicate bile ducts. Magnifications are ×200 (A left panel), ×400 (A,C right panels), ×50 (B,C left panels), and ×100 (B right panel). Space bars are 50 µm (A) and 100 µm (B,C). (D,E) Phospho‐kinase Proteome Profiler arrays of control‐ (D) and SEA‐stimulated (E) human hepatocytes (hiPS‐Hep). The Human Phospho‐Kinase Array is a rapid, sensitive, and economical tool to simultaneously detect the relative levels of phosphorylation of 43 kinase phosphorylation sites. The Human Phospho‐Kinase Array is divided into two parts (left and right panels of each figure) and each kinase is analyzed in duplicate. The red boxes indicate activated c‐Jun, and the blue boxes indicate activated STAT3 (dotted boxes: enhanced activation by SEA stimulation). Please note that other factors that have been described in the context of hepatic carcinogenesis were activated by SEA stimulation, e.g., CREB (arrow) or HSP27 (arrowhead).