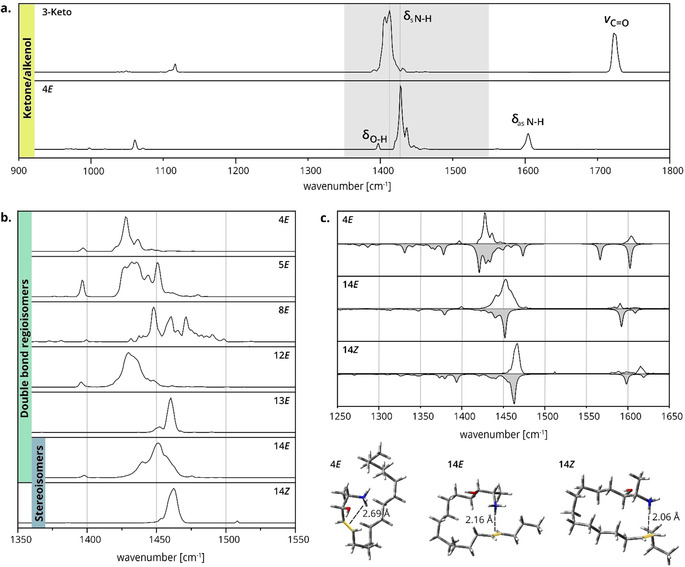
Figure 2.

Gas‐phase IR spectra and low‐energy structures of 1‐deoxysphingolipids. a) IR spectra of isomeric 3‐Keto and 4E. The ketone and alkenol are distinguishable by diagnostic stretching (ν) and bending (δ) vibrations. The most intense bands in the gray region are assigned to NH3 + umbrella vibrations. b) Stacked IR spectra of 1‐deoxySO C=C bond regio‐ and stereoisomers in the region of NH3 + umbrella vibrations (1350–1550 cm−1). The absorption patterns and vibrational frequencies depend on the C=C bond position and configuration. c) Spectral matches of 4E, 14E, and 14Z with calculated IR spectra (gray) of DFT‐optimized structures in the region of NH3 + bending vibrations. The corresponding theoretical structures depicted below highlight the different geometries of charge–olefin interactions.
