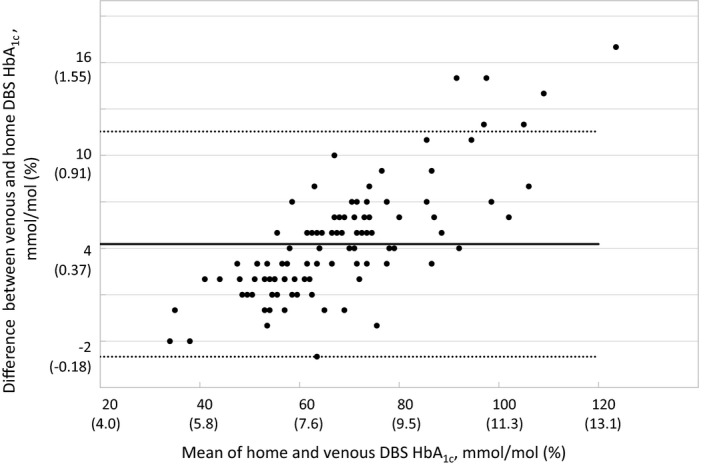
Figure 3.

Bland‐Altman plot, the difference between venous and home dried blood spots (DBS) HbA1c showing evidence of a straight line relationship between the absolute difference and the mean values for the pairs of scores. Solid line: mean of difference; dotted lines, upper and lower 95% confidence intervals.
