Figure 1.

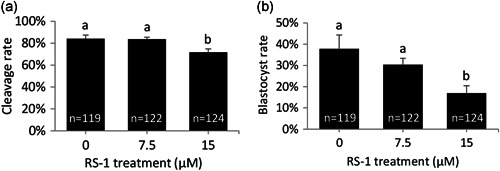
Developmental rates of bovine embryos transiently exposed to 7.5 or 15 µM RS‐1. Cleavage (a) and Day 9 blastocyst (b) rates are depicted. The number of embryos for each group is indicated inside each column. Different letters indicate significant differences based on analysis of variance. p < 0.05
