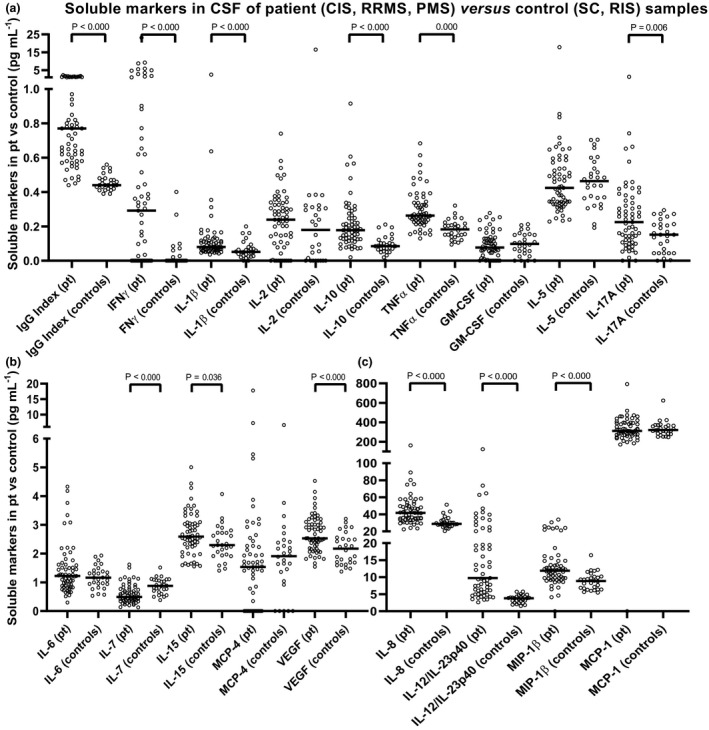
Figure 4.

Differences in the soluble marker levels in CSF of patient (CIS + RRMS + PMS) versus control (SC + RIS) samples. The soluble markers were graphed in pg mL−1: (a) the markers with a median between 0 and 1 (pg mL−1); (b) the markers with a median between 0 and 6 (pg mL−1); (c) the markers with a median above 6 (pg mL−1). The CSF IgG index = (CSF IgG × serum albumin) × (CSF albumin × serum IgG)−1 is included here as the index of local IgG production and it serves as a reference biomarker. Bars represent the median of the population and braces indicate a significant difference (Mann–Whitney U‐test) between the median of the patient group (n = 61) and the median of the control group (n = 28). P‐values are shown. CIS, clinically isolated syndrome; CSF, cerebrospinal fluid; Env, envelope; GM‐CSF, granulocyte‐macrophage colony stimulating factor; IFNγ, interferon gamma; Ig, immunoglobulin; IL, interleukin; MCP‐1, monocyte chemoattractant protein; MIP‐1β, macrophage inflammatory protein‐1β; PMS, progressive multiple sclerosis; Pt, patients; RIS, radiologically isolated syndrome; RRMS, relapsing‐remitting multiple sclerosis; SC, symptomatic control; TNFα, tumor necrosis factor alpha; VEGF, vascular endothelial growth factor.
