
Fig 1.
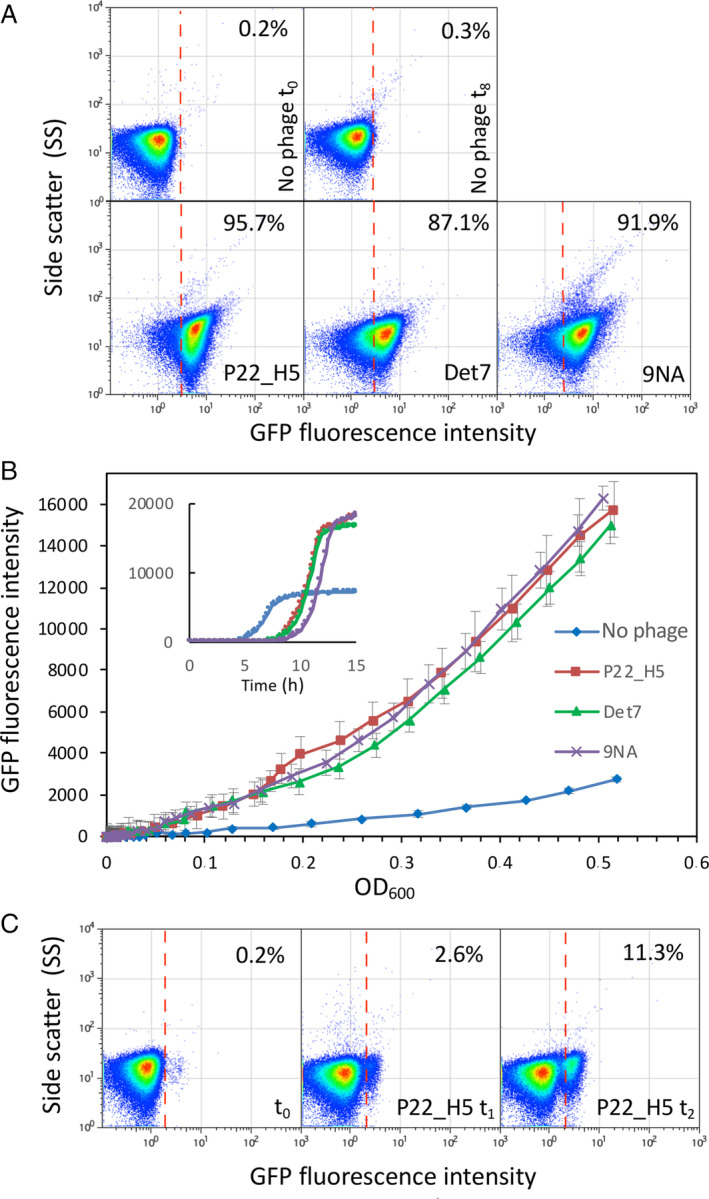
Detection of increased fluorescence intensity upon selection of the OpvABON subpopulation in the presence of bacteriophages.
A. GFP fluorescence distribution in an S. enterica strain carrying an opvAB::gfp fusion (SV6727) before (t = 0 h) and after growth in LB without phage, or in the presence of P22 H5, 9NA or Det7 (t = 8 h). Data are represented by a dot plot (side scatter versus fluorescence intensity [ON subpopulation size]). All data were collected for 100,000 events per sample.
B. Growth curves of strain SV6727 in contact with P22 H5, Det7 or 9NA phage. Data are represented by growth curves (fluorescence intensity) versus growth (OD600) or [time] (insert).
C. GFP fluorescence distribution of strain SV6727 before (t = 0 h) and after growth in LB containing P22_H5 (t = 1 or 2 h). [Color figure can be viewed at wileyonlinelibrary.com]