
Fig 6.
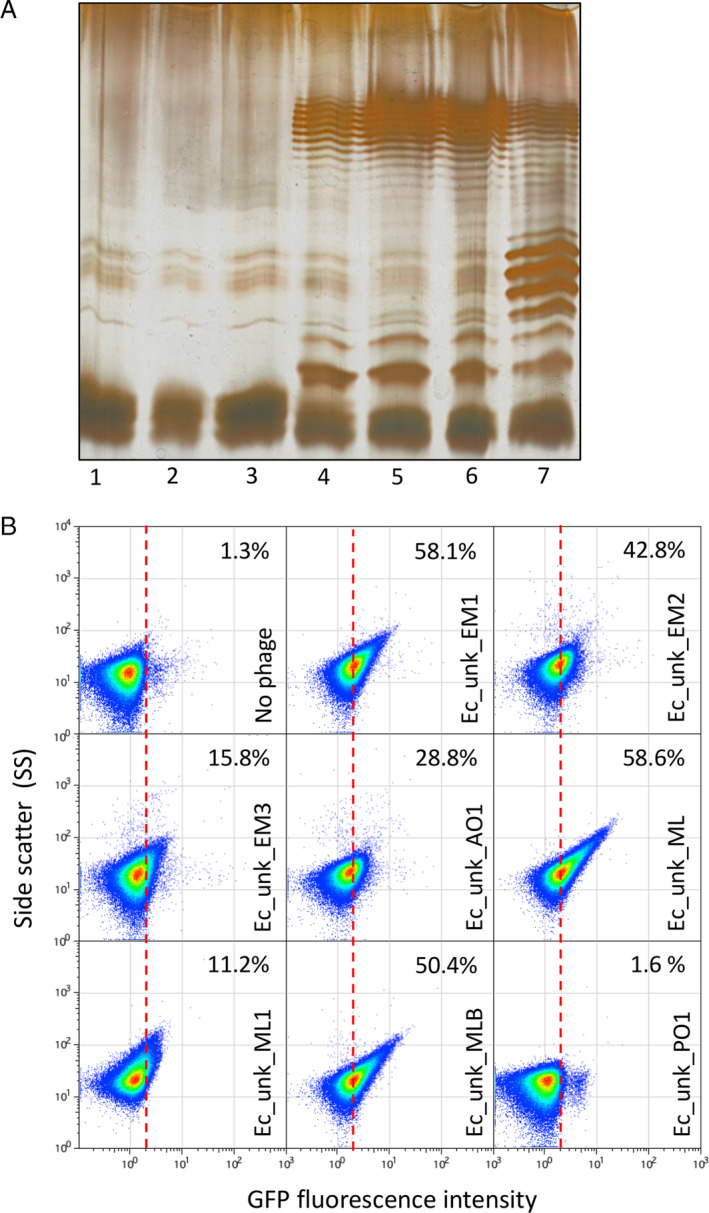
Restoration of E. coli MG1655 O‐Antigen and detection of unknown coliphages.
A. Electrophoretic visualization of LPS profiles from different MG1655 derivatives, as follows: 1, Wild‐type Escherichia coli MG1655 strain containing an IS5‐inactivated version of the wbbl gene; 2, E. coli MG1655 with a deletion of the lactose operon (DR3); 3, E. coli DR3 carrying the empty pETb vector; 4, E. coli DR3 carrying a pETb derivative containing a wild type wbbL gene; 5, E. coli DR3 carrying the wbbL gene integrated into the genome, replacing the altered IS5‐wbbl gene (LPS+ strain); 6, E. coli MG1655 LPS+ carrying the opvAB::gfp construction (DR29); 7, E. coli MG1655 LPS+ opvAB::gfp GATC‐less (DR30).
B. GFP fluorescence distribution in E. coli DR29 before (t = 0 h) and after growth in LB, or LB containing purified uncharacterized bacteriophages (Ec_Unk_EM1, Ec_Unk_EM2, Ec_Unk_EM3, Ec_Unk_AO1, Ec_Unk_ML, Ec_Unk_ML1, Ec_Unk_MLB and Ec_Unk_PO1 (t = 8 h). Data are represented by a dot plot [side scatter versus fluorescence intensity (ON subpopulation size)]. ON subpopulation sizes (percentages) are shown for each sample. All data were collected for 100,000 events per sample. [Color figure can be viewed at wileyonlinelibrary.com]