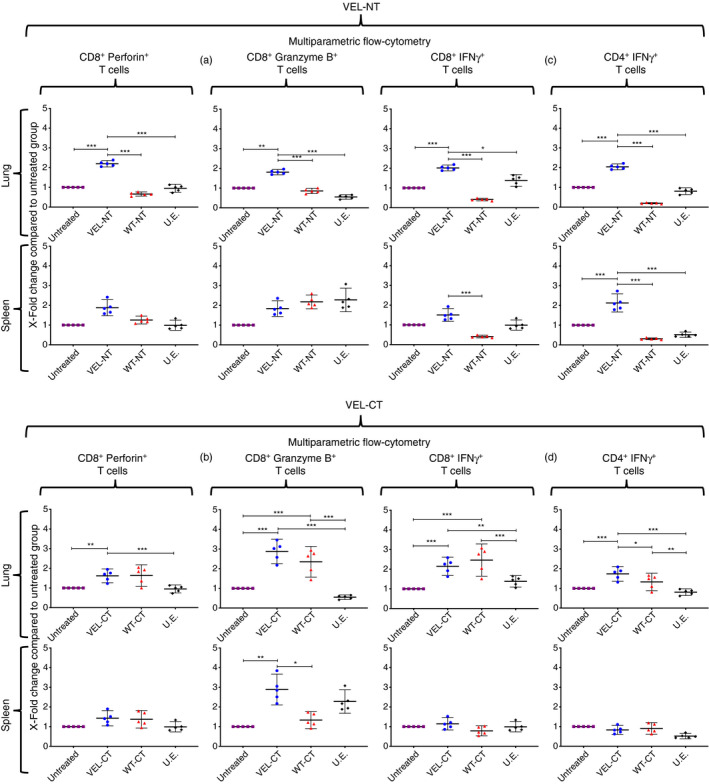
Figure 6.

Effector T‐cell phenotyping. Multiparametric flow cytometry measurement of infiltrating interferon‐γ (IFN‐γ‐), granzyme B‐ and perforin‐producing CD8+ cells and CD4+ IFN‐γ + lymphocytes within lungs and tumors. (a, c) Mice vaccinated with the N‐terminal variable epitope library (VEL‐NT); (b, d): mice vaccinated with the C‐terminal variable epitope library (VEL‐CT). The numbers of lymphocytes in tissues from untreated tumor‐bearing mice were considered as baseline level and X‐fold changes were calculated from them. X‐fold change is presented as mean ± 95 CI (n = 5, each point represents a pool of three distinct tissues from different experiments). *P < 0·033, **P < 0·02, ***P < 0·001. One‐way analysis of variance with Tukey post‐hoc test for multiple comparisons was used.
