
Figure 7.
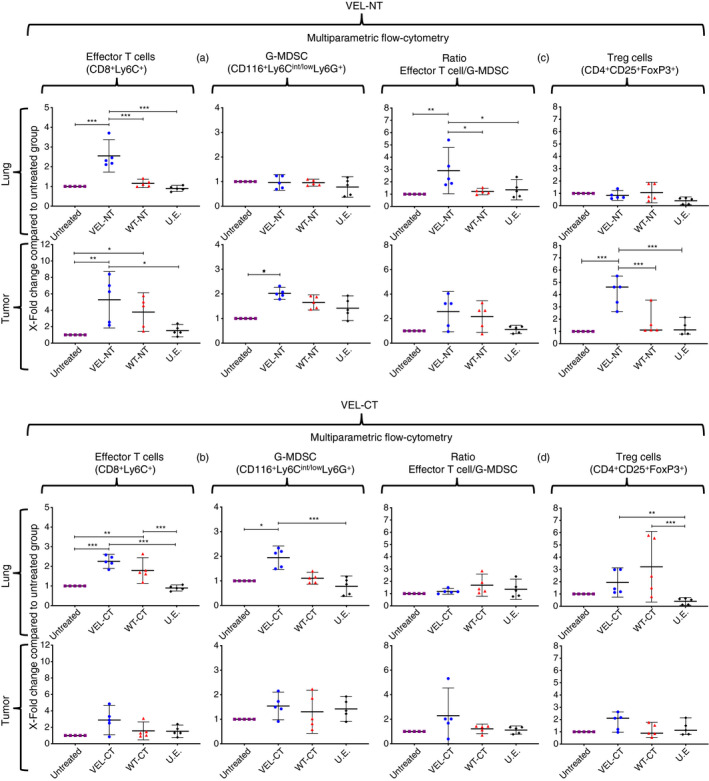
Analysis of variable epitope library (VEL) vaccine‐induced effector/suppressor/regulatory cells. Multiparametric flow cytometry measurement of CD3+ CD8+ Ly6C+ effector T cells, CD11b+ Ly6Cint/low Ly6G+ granulocytic myeloid‐derived suppressor cells (G‐MDSCs) and CD4+ CD25+ FoxP3+ regulatory T (Treg) cells in the lungs and tumors of mice vaccinated with N‐terminal VEL (VEL‐NT) (a, c) and C‐terminal VEL (VEL‐CT) (b, d). Ratios of effector/suppressor cells (CD3+ CD8+ Ly6C+/G‐MDSC) were calculated (c, d). X‐fold changes are presented as mean ± 95 CI (n = 5, each point represents a pool of three distinct tissues of different experiments). *P < 0·033, **P < 0·02, ***P < 0·001. One‐way analysis of variance with Tukey post‐hoc test for multiple comparisons was used.