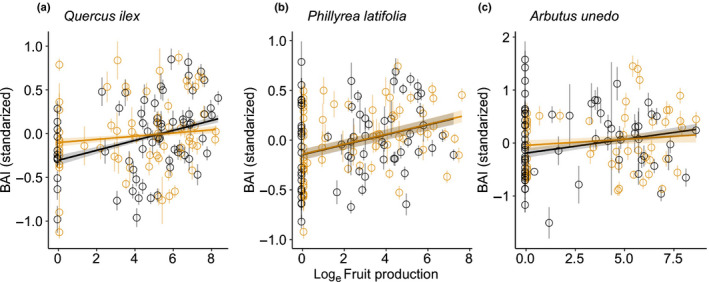
Fig. 4.

Scatterplots of standardised basal area increment (BAI) and fruit production for (a) Quercus ilex, (b) Phillyrea latifolia, and (c) Arbutus unedo in the control and drought plots. The lines and shaded areas are the linear mixed model predictions and associated 95% confidence intervals, respectively. Points and whiskers are plot‐year means and associated SE, respectively. Black represents the control, and yellow represents experimental rainfall exclusion. The sample sizes for these models are 11 288 for Q. ilex (735 stems measured), 15 301 for P. latifolia (842 stems), and 2242 for A. unedo (145 stems).
