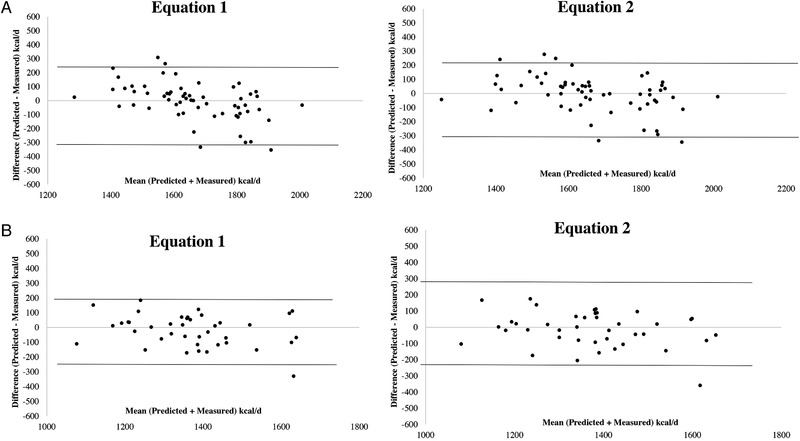
Figure 3.

Bland‐Altman plots. Bland‐Altman plots between differences and mean predicted‐measured resting energy expenditure using the new predictive equations (Equations (1) and (2)) in 55 males (A) and in females (B) with Crohn's disease. The dotted lines represent 2 SDs from the mean (limits of agreement).
