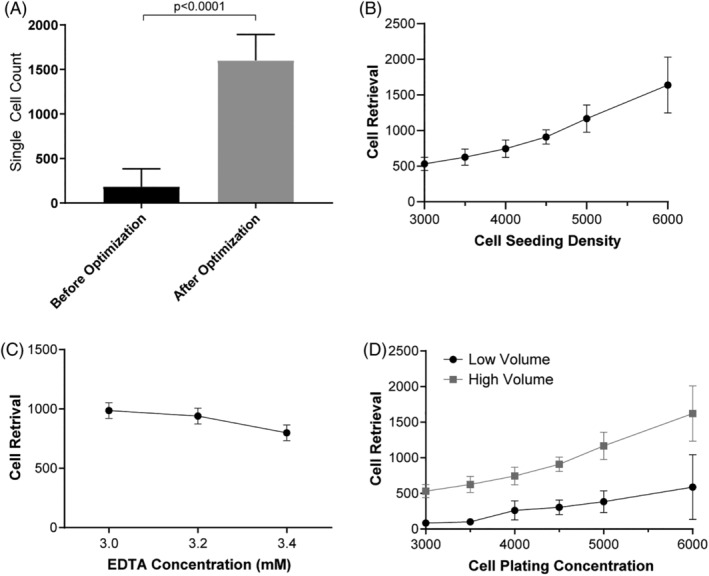
Figure 1.

Optimization of flow cytometric cell retrieval using GIMEN cells. An over 12‐fold increase in single‐cell retrieval is observed upon sample preparation optimization. (A) Bar graph representing average single‐cell retrieval prior to and after optimization. Before optimization: n = 60, after optimization: n = 7,153. (B) Graphical display of flow cytometric cell retrieval when increasing cell‐seeding density. (C) Graphical display of cell retrieval after incubation with increasing EDTA concentrations at a seeding density of 4,500 cells/well, n = 2 per group. (D) Cell retrieval when well volume is 30 μL (low volume) or 80 μl (high volume). Graphs: Dots reflect mean, error bars reflect SD between samples, n = 6 per group unless otherwise indicated. Mann–Whitney U‐test was performed, p < 0.05 was considered significant. SD = standard deviation.
