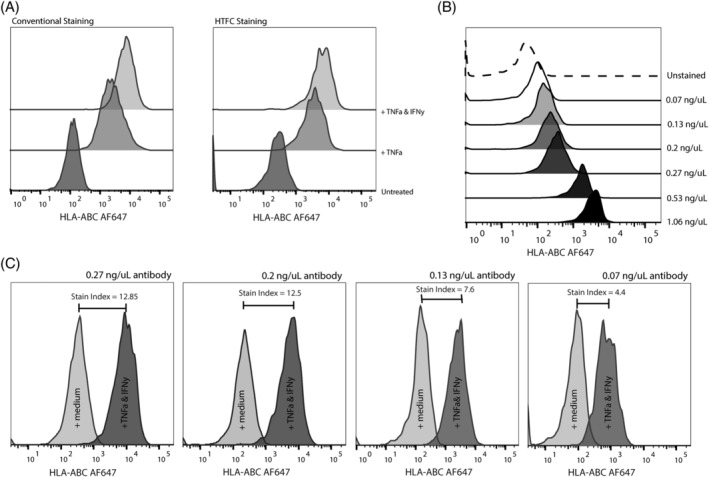
Figure 2.

Antibody staining optimization in GIMEN cells. (A) The optimized HTFC staining protocol (right) shows similar expression patterns to a typical conventional staining protocol (left). Z‐score of expression in untreated versus TNF‐α‐treated cells is 49 (X = 1911, μ = 217, σ = 35), and 94 (X = 3,466, μ = 217, σ = 35) in TNF‐α + IFN‐γ treated cells (n = 8 per group). (B) HLA‐ABC background staining decreases when antibody concentration (ng/μL) decreases. The dashed line represents the unstained control. (C) Histograms depicting HLA‐ABC MFIs of untreated and TNF‐α + IFN‐γ‐treated samples with diluting antibody concentrations. The stain index decreases when antibody concentration is reduced. Data shown are from a representative experiment using the HTFC protocol on GIMEN neuroblastoma cells. MFI = mean fluorescent intensity.
