FIGURE 2.

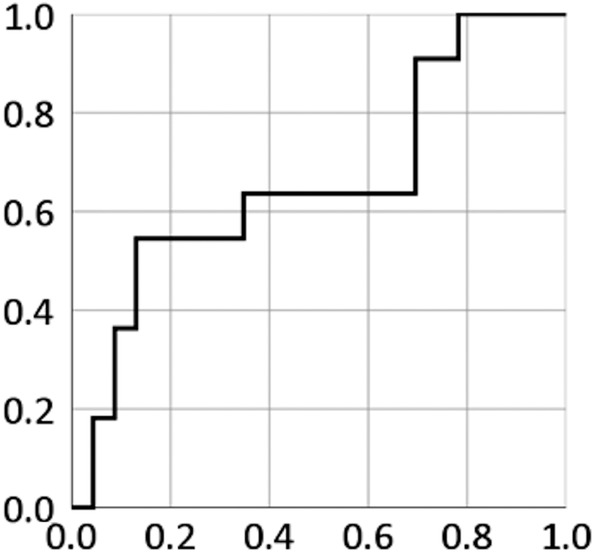
A receiver operator characteristic (ROC) curve for the detection of local control using gross tumor volume. The area under the ROC curve is 0.677 (95% confidence interval: 0.610‐0.744)

A receiver operator characteristic (ROC) curve for the detection of local control using gross tumor volume. The area under the ROC curve is 0.677 (95% confidence interval: 0.610‐0.744)