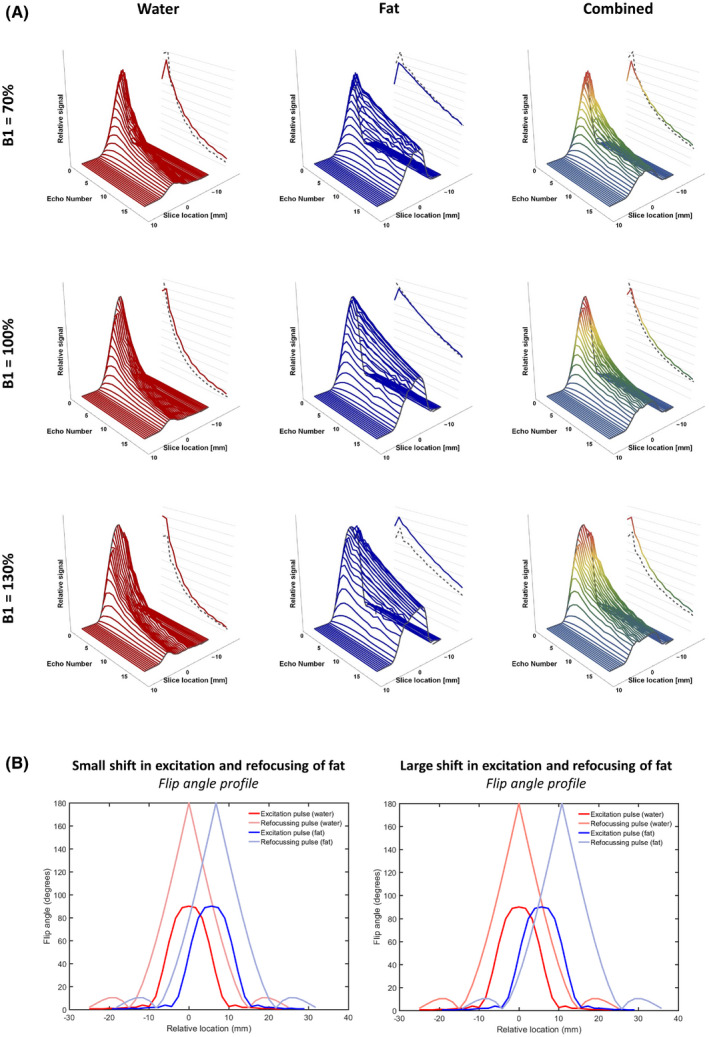
FIGURE 1.

A, Signal profiles for a B1 of 70%, 100%, and 130%, from left to right. Noticeable is the asymmetry around a B1 of 100%. The right dotted line in each signal profile represents the signal in the center of the slice, and the right colored line depicts the final signal after averaging all signal contributions. B, Example flip‐angle profile of the pulses throughout the slice. The left side shows an example of a flip‐angle profile with a minor shift (1.1 mm) between the excitation and refocusing pulse as experienced by the fat, and the right side shows an example of a major shift (5.1 mm)
