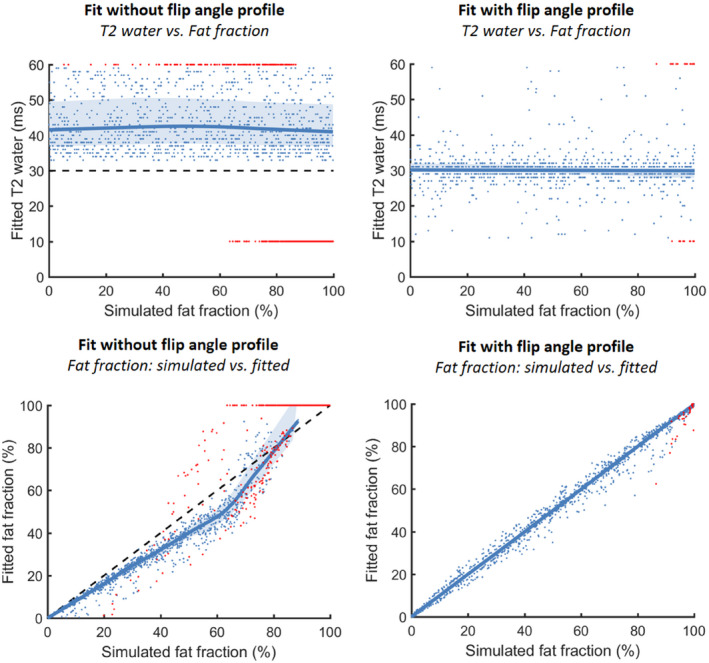
FIGURE 3.

Simulation 1A shows the relationship between the simulated fat fraction and the fitted T2water for simulation without incorporation of the flip‐angle profile (T2water: median: 40 ms [34‐57 ms], on dictionary boundaries: 30%) and fitted by incorporating the flip‐angle profile (top row) (T2water: median: 30 ms [26‐35 ms], on dictionary boundaries: 1.5%). In the bottom row, the relation between the simulated fat fraction and the fitted fat fraction is shown without and with the flip‐angle profile. The values fitted on dictionary boundaries are depicted in red, and the correctly fitted values are depicted in blue. A reference line is shown at a T2water of 30 ms, and a unity line is shown for the fat fractions
