
FIGURE 4.
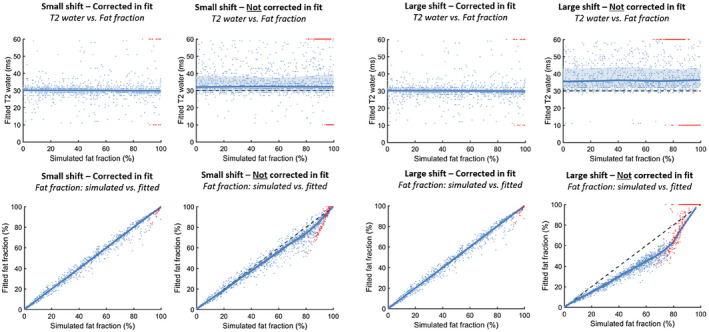
Simulation 2 shows the effect of simulating data with a chemical shift in the location of the pulses and fitting it with or without incorporating the chemical shift of the slice. The four figures on top show the simulation with a small shift (T2water: median: 32 ms (28‐51 ms), on dictionary boundaries: 6.8%; and fat fraction: intercept: 0.72%, slope: 0.92), and the four figures on bottom show the simulation with a large shift (T2water: median: 34 ms (30‐53 ms), on dictionary boundaries: 22%; and fat fraction: intercept: −1.28%, slope: 0.79). The values fitted on dictionary boundaries are depicted in red, and the correctly fitted values are depicted in blue. A reference line is shown at a T2water of 30 ms, and a unity line is shown for the fat fractions