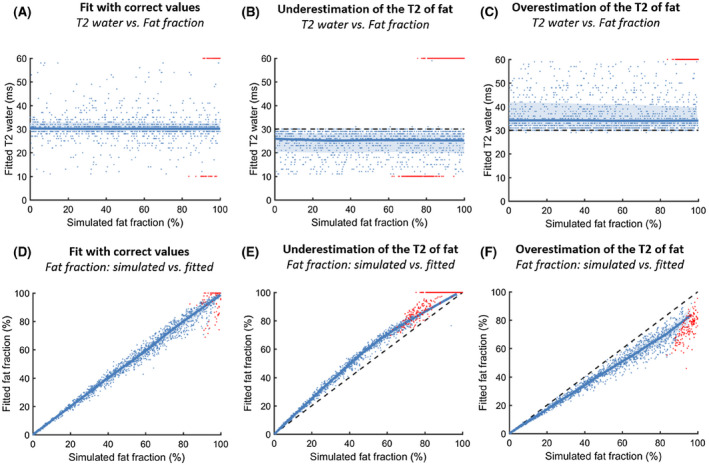
FIGURE 5.

Simulation 2 shows the effect of fitting simulated data with different assumed T2fat values. A, Top row shows the T2water for assuming the correct T2fat (T2water: median: 30 ms [23‐38 ms], on dictionary boundaries: 4%. B, Underestimation of T2fat (T2water: median: 26 ms [14‐30 ms], on dictionary boundaries: 26%. C, Overestimation of T2fat (T2water: median: 33 ms [30‐51 ms], on dictionary boundaries: 9%). D‐F, Relationship between the simulated fat fraction and fitted fat fraction. The values fitted on dictionary boundaries are depicted in red, and the correctly fitted values are depicted in blue. A reference line is shown at a T2water of 30 ms, and a unity line is shown for the fat fractions
