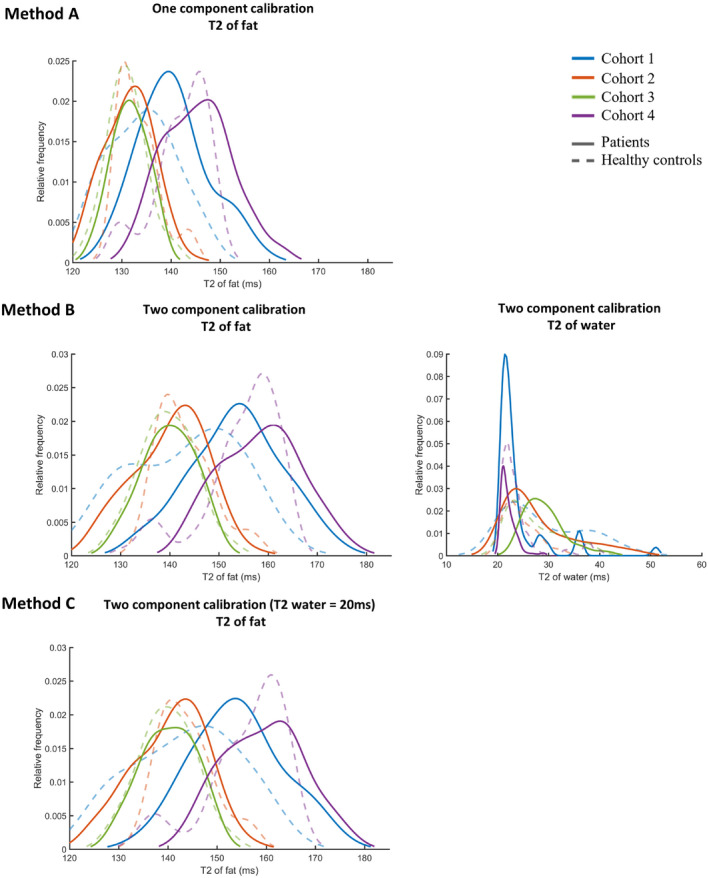
FIGURE 6.

Outcome of the calibration of the T2fat on subcutaneous fat for methods A, B, and C. The values for the patients in the cohorts are shown as a solid line, and the values for the healthy controls are shown as a dashed line. Method A with one‐component calibration leads to a lower T2fat (137 ms, 132 ms, 131 ms, and 144 ms for cohorts 1‐4, respectively) than method B with two‐component calibration (149 ms, 141 ms, 140 ms, and 158 ms for cohorts 1‐4, respectively). The calibrated T2fat is comparable for method B without a fixed T2water and method C with a fixed T2water (150 ms, 142 ms, 140 ms, and 159 ms for cohorts 1‐4, respectively)
