
FIGURE 7.
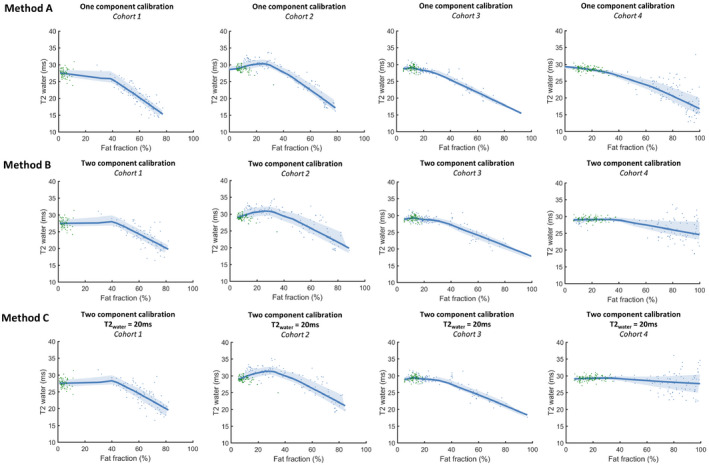
Association between the fat fraction and the T2 of the water component in vivo in four cohorts (cohorts 1‐4 from left to right) for the two calibration methods: A (top row), B (middle row), and C (bottom row). Healthy controls are depicted in green, and patients are depicted in blue. Values are shown for each of the five slices per individual