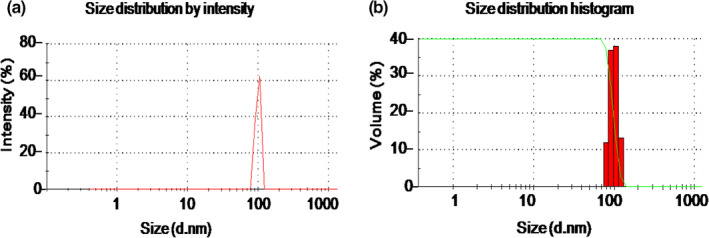
FIGURE 1.

Characterization of the prepared CSNPs. (a) Particle size by intensity peak referring at 105 nm, and (b) particle size distribution including red column chart showing narrow size distribution range from 70 to 140 nm, and green disciplined Z‐shaped peak showing the homogenous distribution of the particles. All data were expressed as means ± SD (n = 3)
