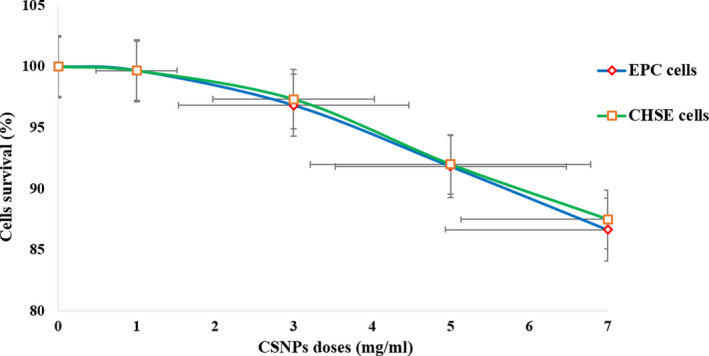
FIGURE 11.

Cytotoxicity of CSNPs on EPC and CHSE cells assessed by the trypan blue exclusion assay. Cells viability is expressed as mean per cent ± SD (n = 3). No significant differences (p = .99) were observed on the viability of both cell lines at the treatments 1 mg/ml, or on the viability of CHSE cells at the treatment 3 mg/ml (p = .1). Significantly lower viability was observed on EPC cells at 3, 5 and 7 mg/ml (p < .003), and on CHSE cells at 5 and 7 mg/ml (p < .001)
