
Figure 2.
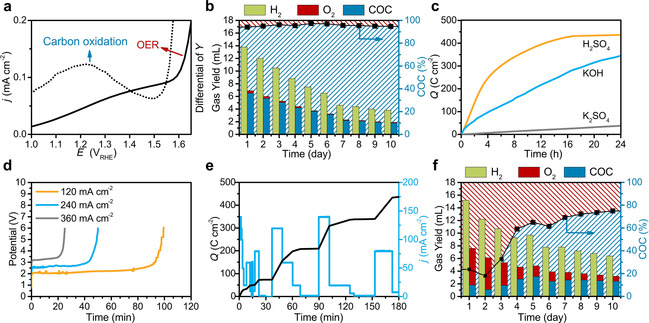
a) Current–potential curve of a carbon as electrode and the relative differential curve (dashed line). b) Daily gas collection in a two‐electrode cell: hydrogen at the cathode; oxygen and the carbon oxidation contribution (COC) at the anode. Red‐shaded areas demonstrate the hydrogen production from water oxidation (catalytic process), whereas blue‐shaded areas are the hydrogen production from carbon oxidation. c) Charge collection of the carbon pellet in acidic (H2SO4, pH 1), alkaline (KOH, pH 13), and neutral (K2SO4, pH 7) electrolytes. d) Stability of the carbon pellets in 1 m KOH at current densities of 120, 240, and 360 mA cm−2. e) Performance of the carbon pellet under dynamic potential variations to mimic the flexibility of solar‐derived electricity. f) Daily gas collection in a two‐electrode cell of the nitrogen‐containing carbon pellet.