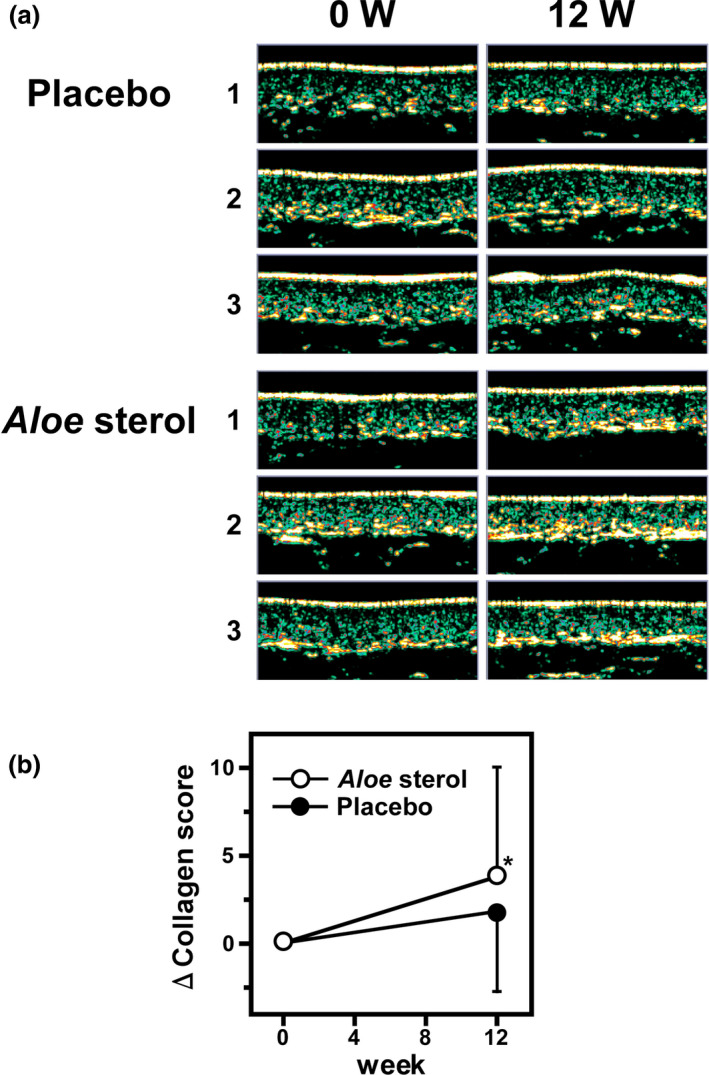
Figure 3.

Ultrasonography evaluations. (a) Ultrasound skin images of collagen content before and after 12 weeks of ingestion of Aloe sterol or placebo. Representative images of three subjects from each group are shown. (b) ΔChanges in the collagen scores before and after the ingestion. Data are expressed as means ± standard deviation (Aloe sterol group, n = 60; placebo group, n = 58). *P < 0.05, versus values in placebo group.
