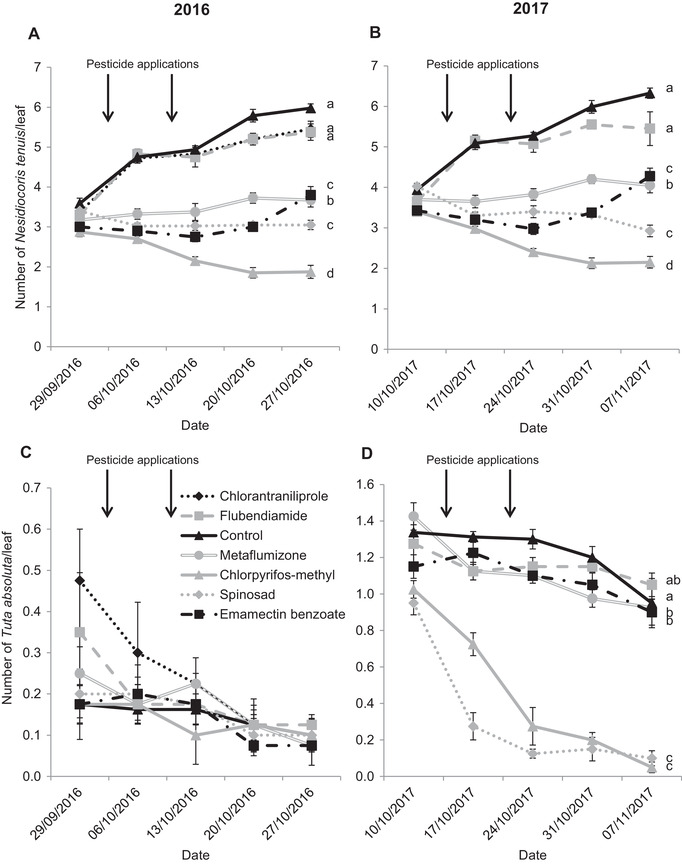
Figure 1.

Mean ± SEM population of Nesidiocoris tenuis and Tuta absoluta per leaf inside tomato commercial greenhouses in 2016 (A and C) and 2017 (B and D) after two pesticide applications on September 30 and October 11, 2016, and on October 11 and 21, 2017. Arrows point out the moment of pesticide applications. Different letters stand for statistical differences among treatments according to a Linear Mixed Model test using pesticide as the fixed factor and sampling dates as the repeated measures factor, followed by LSD pairwise comparisons (P < 0.05).
