
FIGURE 3.
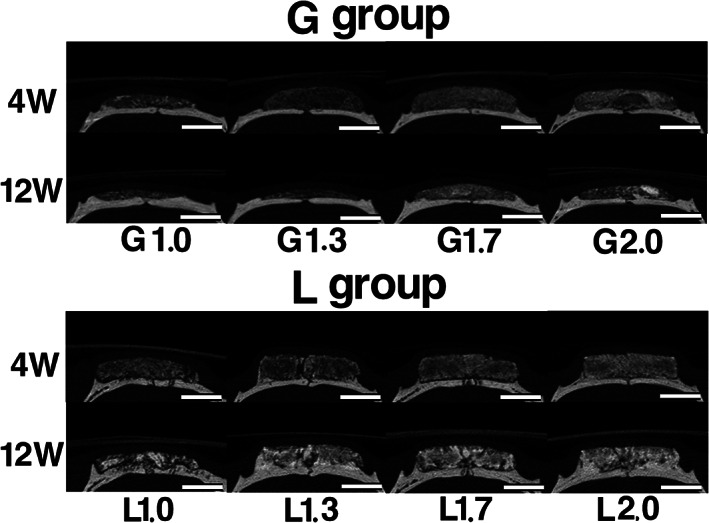
Micro‐computed tomography (micro‐CT) images at 4 and 12 weeks after implantation. The top of the images indicates the skin side, and the bottom is the original bone side. In G group samples, mixed granulous radiopaque and radiolucent figures were observed at 4 weeks after implantation. Additionally, radiopaque mass was observed in G2.0 at 12 weeks after implantation. Original bone in G2.0 became thinner at 4 weeks after implantation, and it became thinner in G1.7 and G2.0 at 12 weeks after implantation. In L group samples, mixed granulous radiopaque and radiolucent figures were observed at 4 and 12 weeks after implantation. At 12 weeks after implantation, radiopacity was more dominant near the original bone and outer marginal area, and the interface between octacalcium phosphate and collagen composite and original bone became unclear. Bars: 4 mm