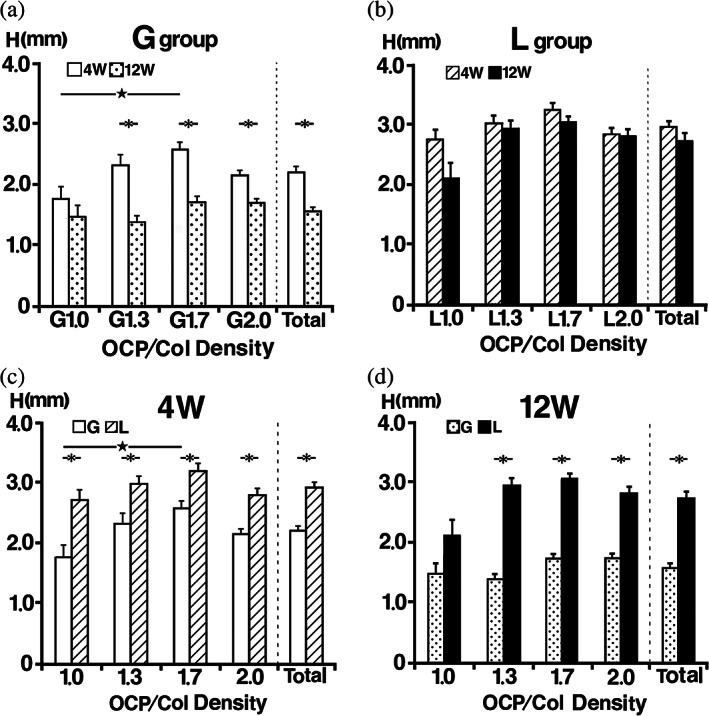
FIGURE 4.

Radiomorphometric analysis of the implant height. (a) In the G group at 4 weeks, a significant difference was observed between the heights of G1.0 and G1.7. At 12 weeks, no significant difference was observed among these samples. In samples G1.3, G1.7 and G2.0, there was a significant difference between the heights at Weeks 4 and 12. (b) In the L group at 4 and 12 weeks, there was no significant difference between samples in this group at each experimental period. Although the difference was not significant, there was a noticeable change in the height of L1.0 between Weeks 4 and 12. (c) Samples with the same concentration of octacalcium phosphate and collagen composite were compared across the groups, the height of samples in the L group at Week 4 was significantly higher than those in the G group. (d) The height of samples in the L group at Week 12 was higher than those in the G group
