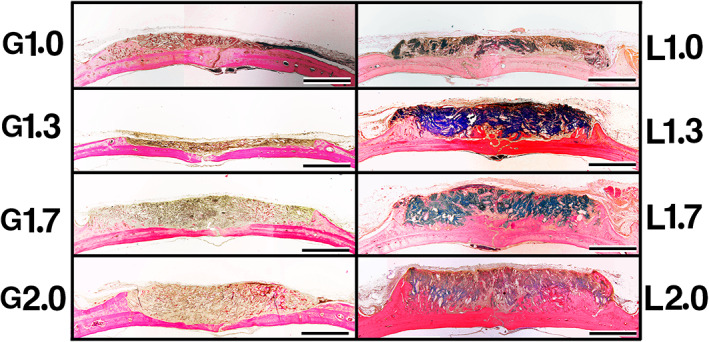
FIGURE 6.

Histological overview of implants at 12 weeks postimplantation. In the G group, there was a little newly formed bone in the marginal area in all samples. The height of G1.0 and G1.3 had decreased more than that of G1.7 and G2.0, and in cases of G1.7 and G2.0, the original bone had become thinner. In the L group, newly formed bone was dominant near the original bone and outer marginal area, and the amount of new bone increased as the density of octacalcium phosphate and collagen composite in samples rose. Bars: 4 mm
