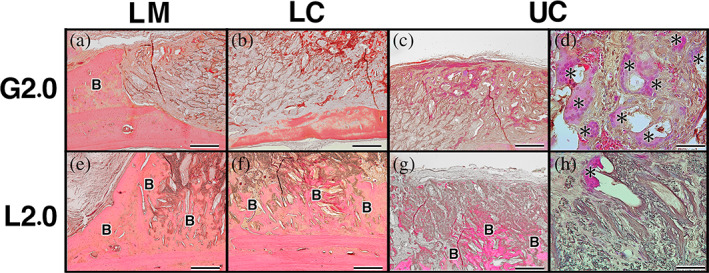
FIGURE 7.

Histological examination of implants at 12 weeks postimplantation. (a) In the case of G2.0, there was newly formed bone in lower marginal area (LM). (b) Original bone had become thinner in lower central area (LC). (c) There was no bone near the skin side in upper central area (UC). (d) Additionally, there was large amount of multinucleated giant cells (MNGCs) and the implanted collagen was disintegrated in UC. (e) In the L2.0, new bone formed from the original bone toward the skin side in LM. (f) New bone was more dominant near the original bone in LC. (g) Newly formed bone was observed near the skin side in UC. (h) The implanted collagen retained its framework and a small amount of MNGCs was observed near the skin side in UC. Bars: 200 μm (a–c and e–g), Bars: 50 μm (d, h); B, newly formed bone; asterisk indicates MNGCs
